GBPUSD Analysis – Very technical downswing
In this analysis, we will talk about another instrument with the USD – Cable. About this pair, we wrote a piece on the 1st of October and we were also bearish. AUDUSD gave us nice profits, how about the GBPUSD? First, let me show you our previous work, where we concluded the analysis with this:
“Flag resulted with a drop, which allowed to break the horizontal support on the 38,2% Fibonacci. And here we are, the next target is on the 50% Fibo, chances that we will get there are very high. „
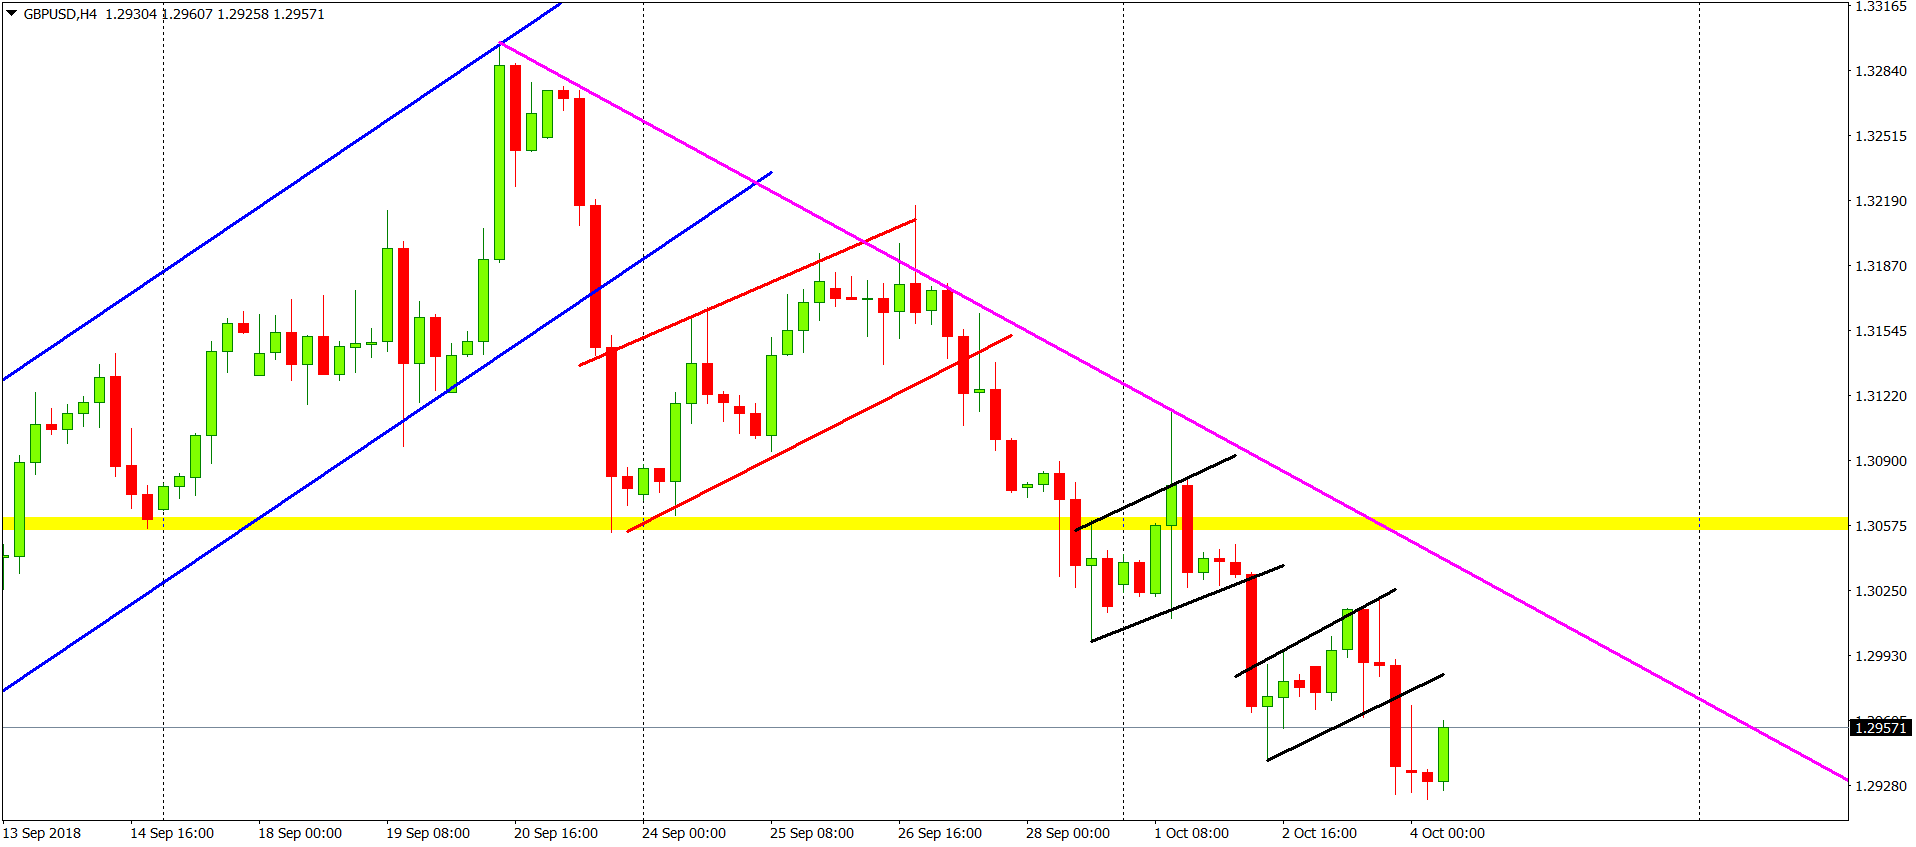
After those words were written, we got a flag and then, another flag (black lines). Both of them were very technical as they both resulted with the breakouts to the downside. The slide is very technical as the GBPUSD is making lower lows and highs. The most important line now is the pink down trendline and as long as we stay below this one, the sentiment is negative and we should continue the main trend. Our view for the nearest future remains negative.


Comments (0 comment(s))