Crypto Report – Ethereum, Ripple and NEO – our predictions were spot on!

In this crypto report we will analyse three different altcoins. In the last week, we already wrote pieces about all of them, so today we will just check our predictions and upgrade them for the future.
First one is Ripple. We wrote about the XRP on Tuesday, March 13th. Back in that day, we stated that:
„ Currently, the price is attacking the mid-term up trendline (lower red) and it looks like this attempt will finish with a bearish victory (no signs of a demand whatsoever)…As for the potential targets for this drop, we do have two here: 0,65 (black) and 0,3 (green). Chances that we will get there in the nearest future are quite high, especially considering the global atmosphere around the cryptos and the scale of the recent reversal. „
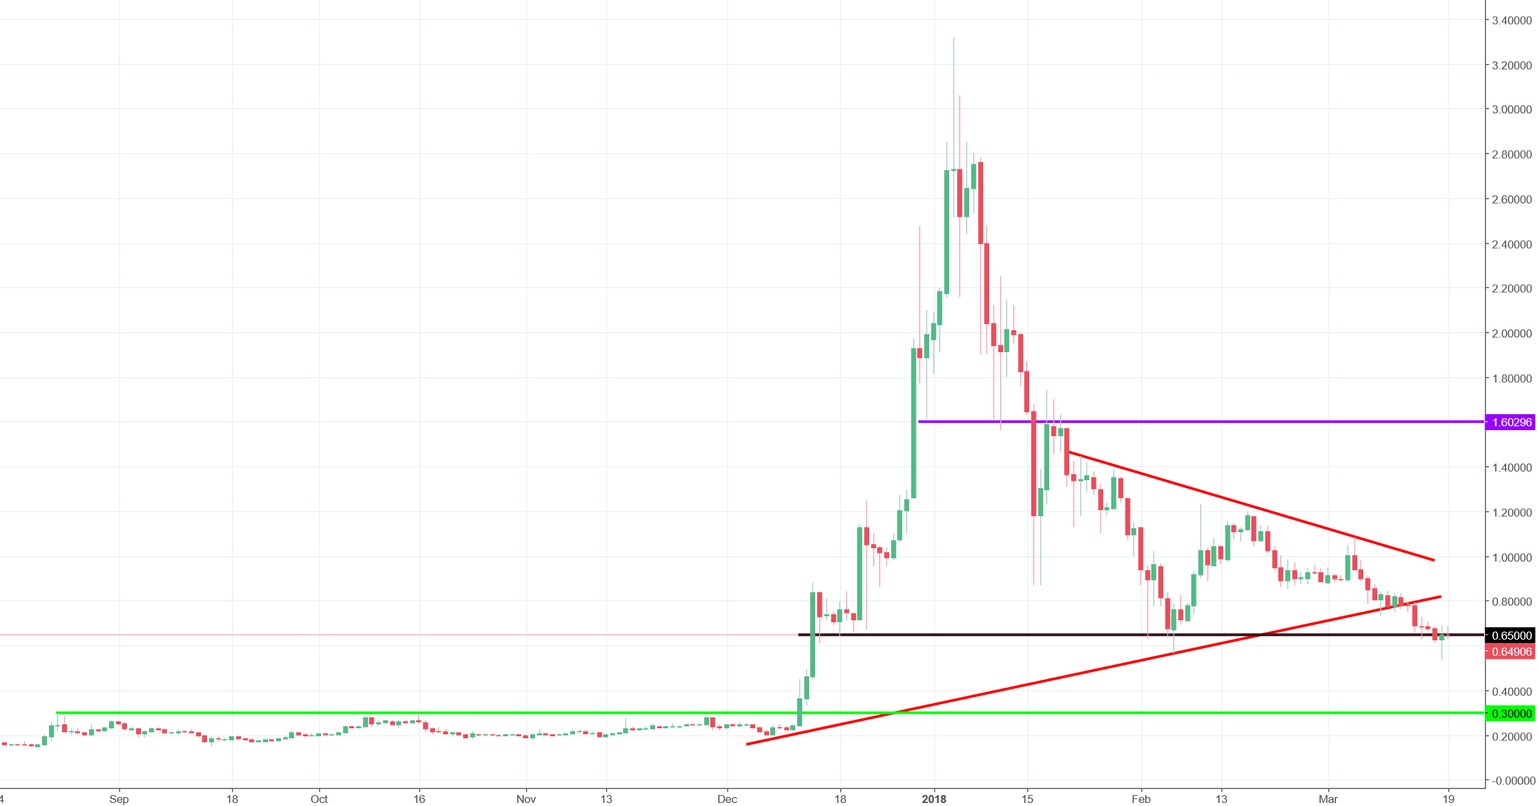
Guess what, the price broke the mid-term up trendline mentioned above and went lower to test the 0.65 (black). That is where the demand woke up and yesterday, created a reversal candlestick pattern on the daily chart (hammer). It is optimistic but the thing is, that the price does not want to reverse today. After this kind of a candle on a horizontal support, we should see a bounce. We do not, so the test of the 0.3 support remains an opened case. The price closing above the 0.65 will be a positive sign and the price closing around the tail of the previous candle, will be a signal to go short.
Next crypto is Ether. We wrote about the ETH also on the 13th of March. Another lucky day (not really, its pure knowledge) for our team. Back in that day, ETH costed 736 USD and we said that the sentiment is negative and we are very close to the major sell signal:
„Technical situation does not look too good here. The price is forming a huge head and shoulders patten. Currently, we are very close to the neckline of this formation (blue), which creates a dangerous situation for the demand – a possible bearish breakout. „
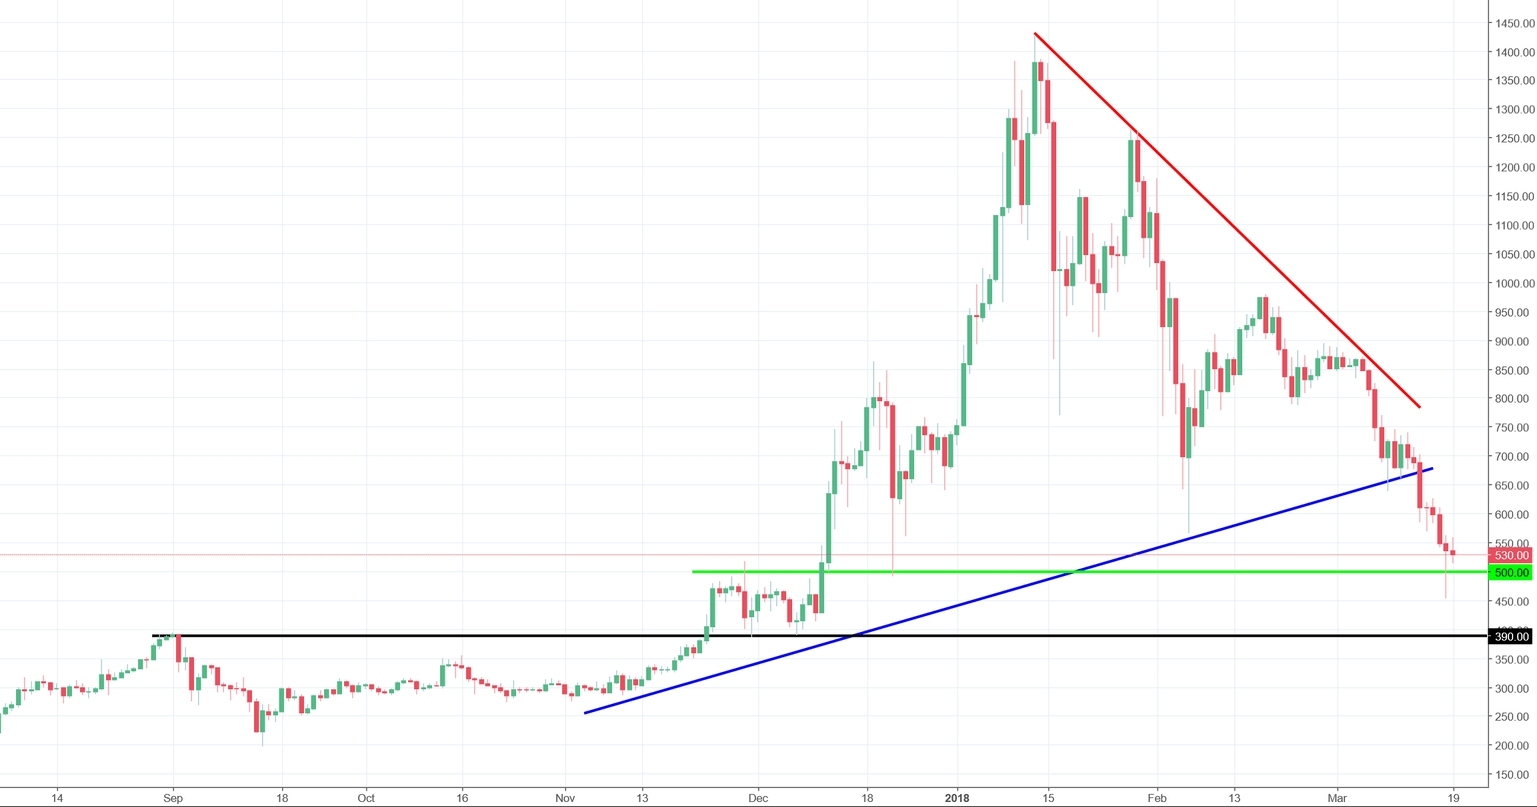
The day after our analysis, the price broke the neckline and the price declined to the 500 USD – an important mid-term support. This is where Ethereum created a hammer – the same type of candle as Ripple mentioned above. That crates a chance for a bullish correction here too. How we should trade this? In the case of ETH, as long as we stay above the 500USD, we still have chances for a bullish correction. The price closing a day below that green line, will be a strong signal to sell again.
The last altcoin here is NEO. We analysed this crypto a day later – on the 14th of March, when NEO was around 72 USD. We were also bearish and we wrote that:
„NEO currently has both: negative sentiment and a sell signal”
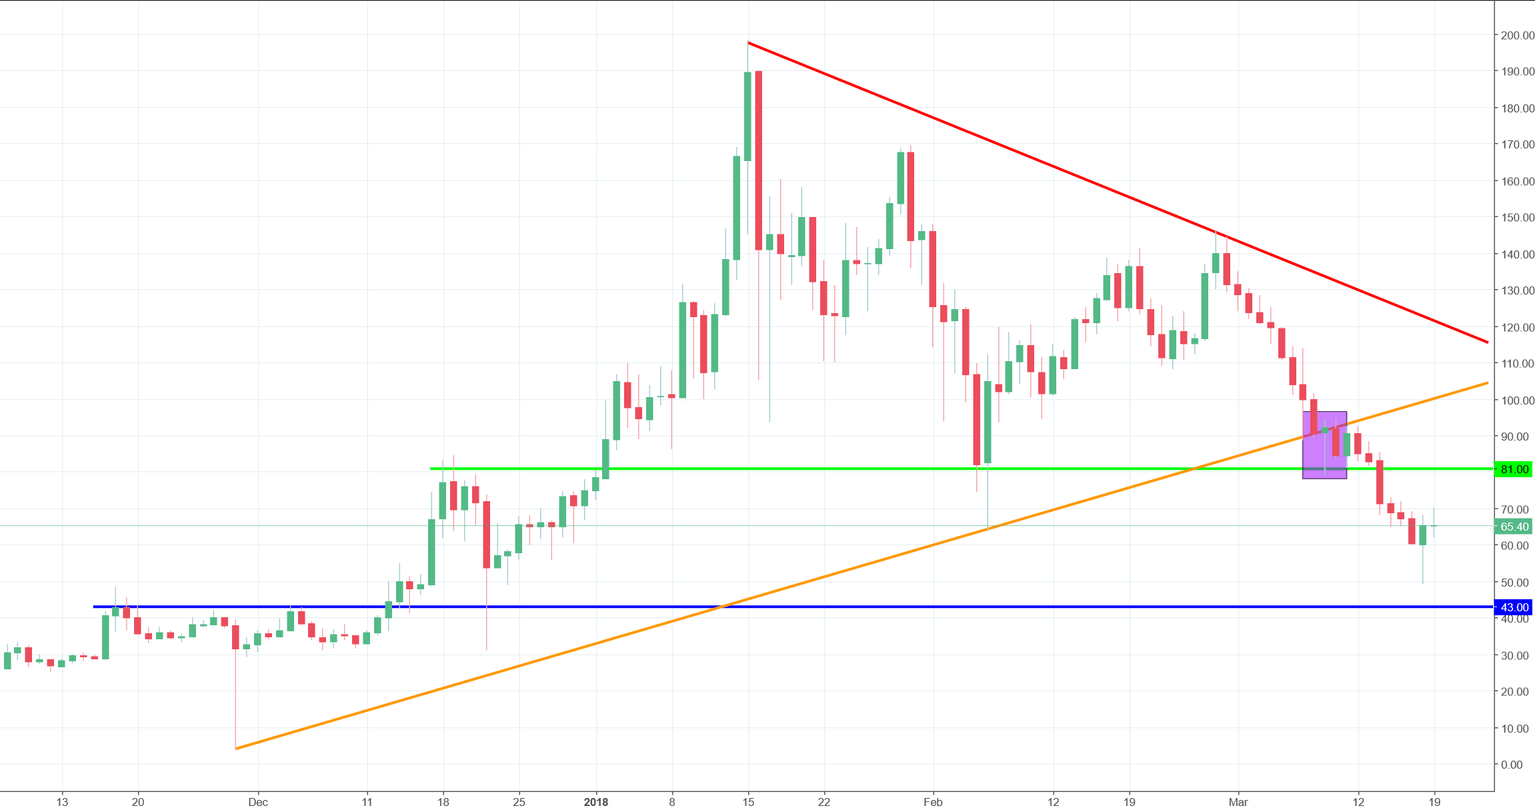
43 USD – that was our target for the downswing. Yesterday, the price made a new low on the 49 USD, close but not there yet. As long as we stay below the 81 USD (green), which is a strong resistance, the sentiment stays negative and the chances that we will test the 43 USD are much higher. Comeback above the 81 USD will be a very positive sign and can bring us a trend reversal but chances for that are now limited.


Comments (0 comment(s))