Crypto Report – Great setups on Monero, EOS and Stellar Lumens

Another crypto report and another time to deal with our previous picks. Today we will write about the Monero, EOS and Stellar Lumens.
Monero still inside the triangle.
Monero appeared in our analysis on 13th of March. We were in the middle of the symmetric triangle pattern and we were waiting for a proper trading signal. We advised patience and we said that it would be the best to wait with the trading for the breakout from the triangle. Well, that was one approach but we can see that the price do not really want to escape from the triangle. So if we cannot trade the breakouts, let’s trade the bounces.
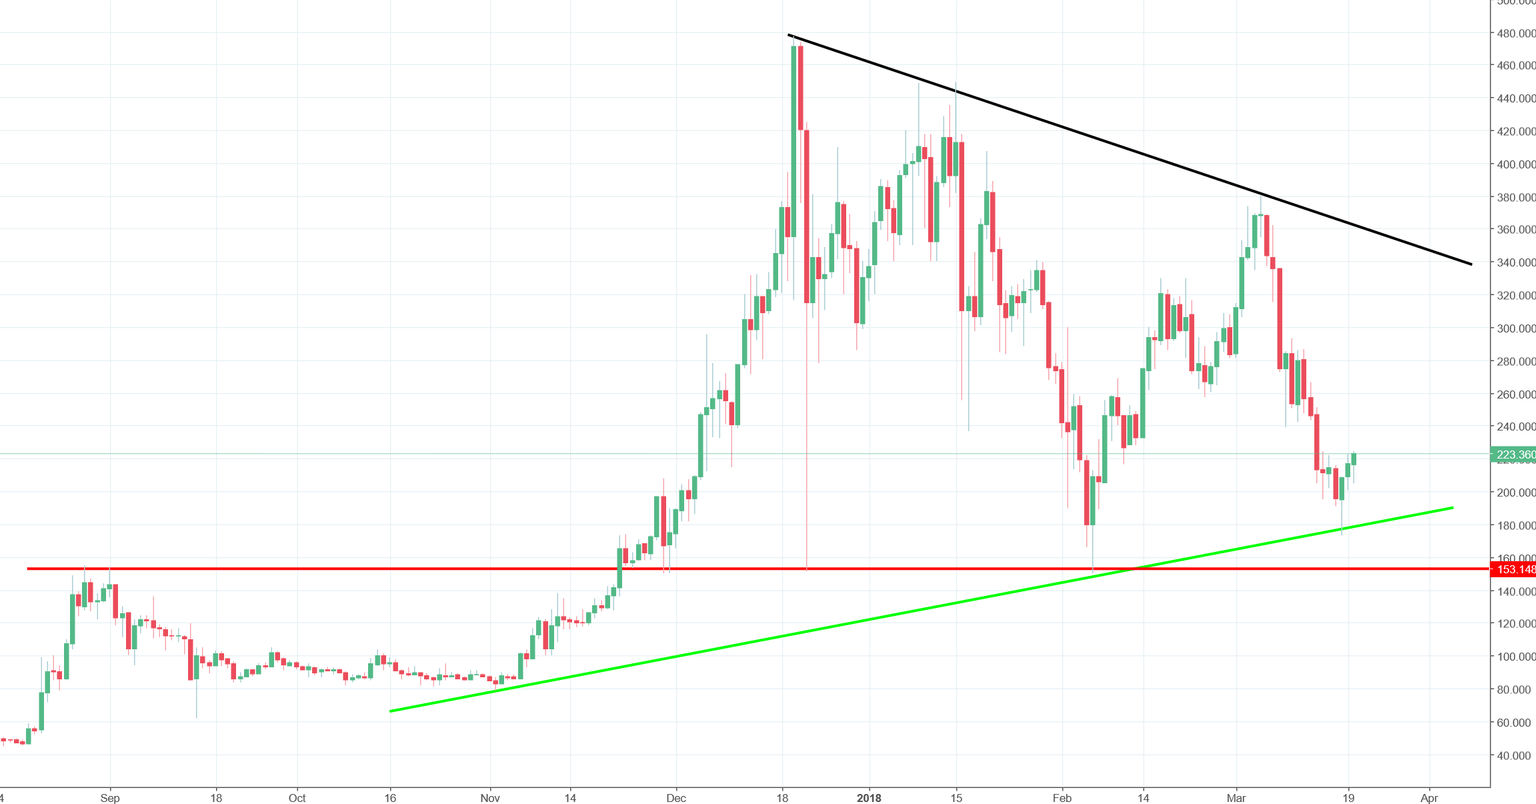
Monero fell nicely and tested the lower line of the triangle. The price bounced and created an interesting hammer on the daily chart. Hammer was confirmed yesterday and today because the price is making higher lows and higher highs. That brings a ray of hope here and creates a good opportunity for the short/mid-term buyers of this crypto.
EOS bounces from 4.8 USD
The next altcoin is the EOS analysed by us on the 16th of March. Back in that day we were very negative but we spotted a nice support…
“Currently, we are on a support on the 4.8 USD. This is the last chance for the buyers to keep the EOS dream alive. Once this area will be broken, the next target will be…zero. „
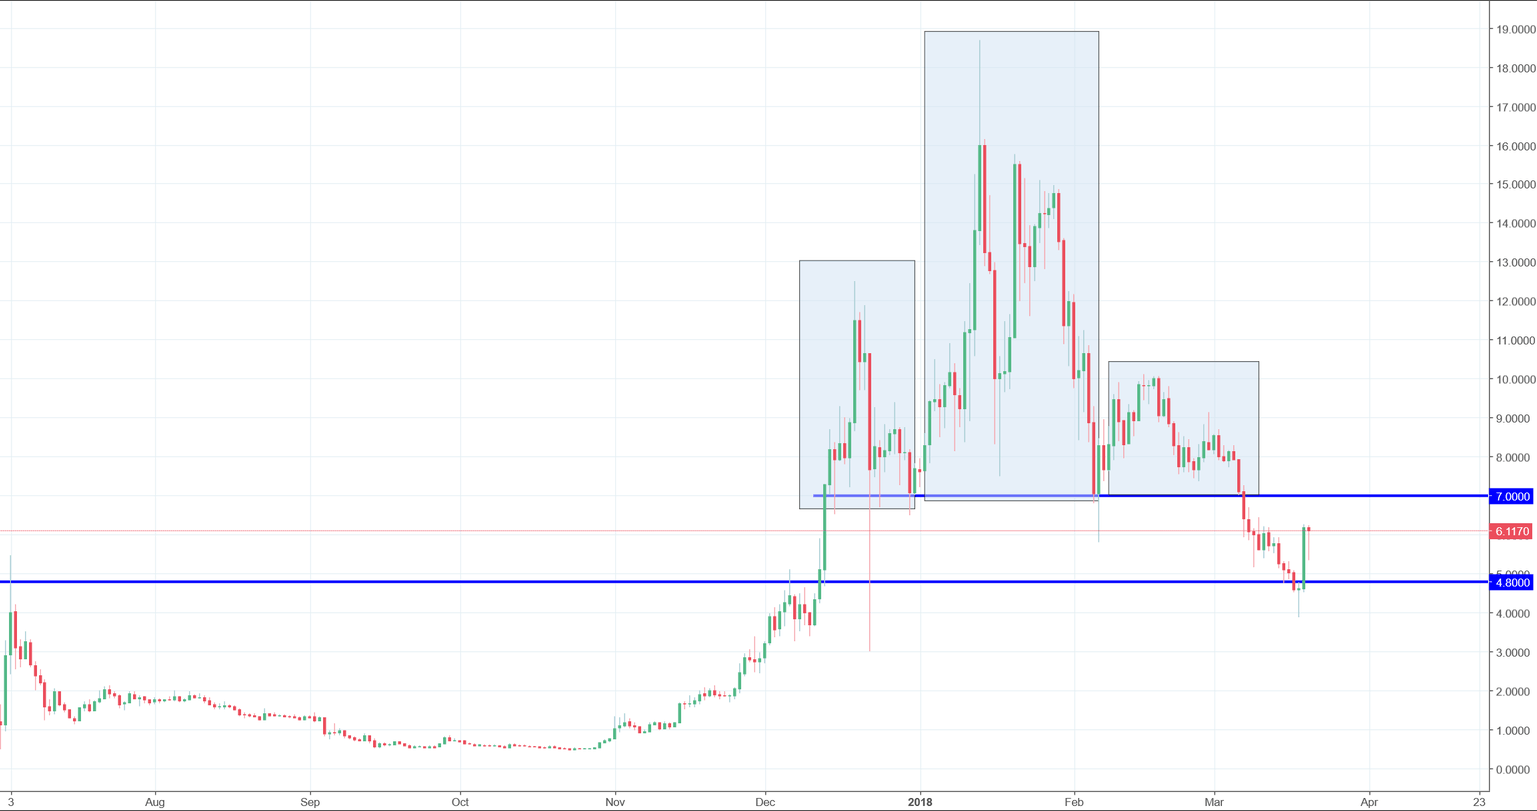
4.8 indeed worked like a charm. Candle from yesterday, which bounced from this level is one of the strongest in the recent few months. In this case, bullish dream is still alive. The next target for the EOS is the 7 USD. Chances that we will get there are relatively high. Candle from today is so far bearish but does not deny the yesterday’s movement. I think that it is not the last time that we hear about the 4.8 USD here. This support may be crucial again soon.
Stellar Lumens – touches lower line of the wedge
Stellar Lumen is the last crypto in today’s analysis. You will definitely like this one. On the March 13th the price was around the 0.28 and we wrote here that:
“Taking all that into the consideration, our outlook is negative and in the nearest future, we should witness a drop, aiming the lower line of the wedge (lower orange). „
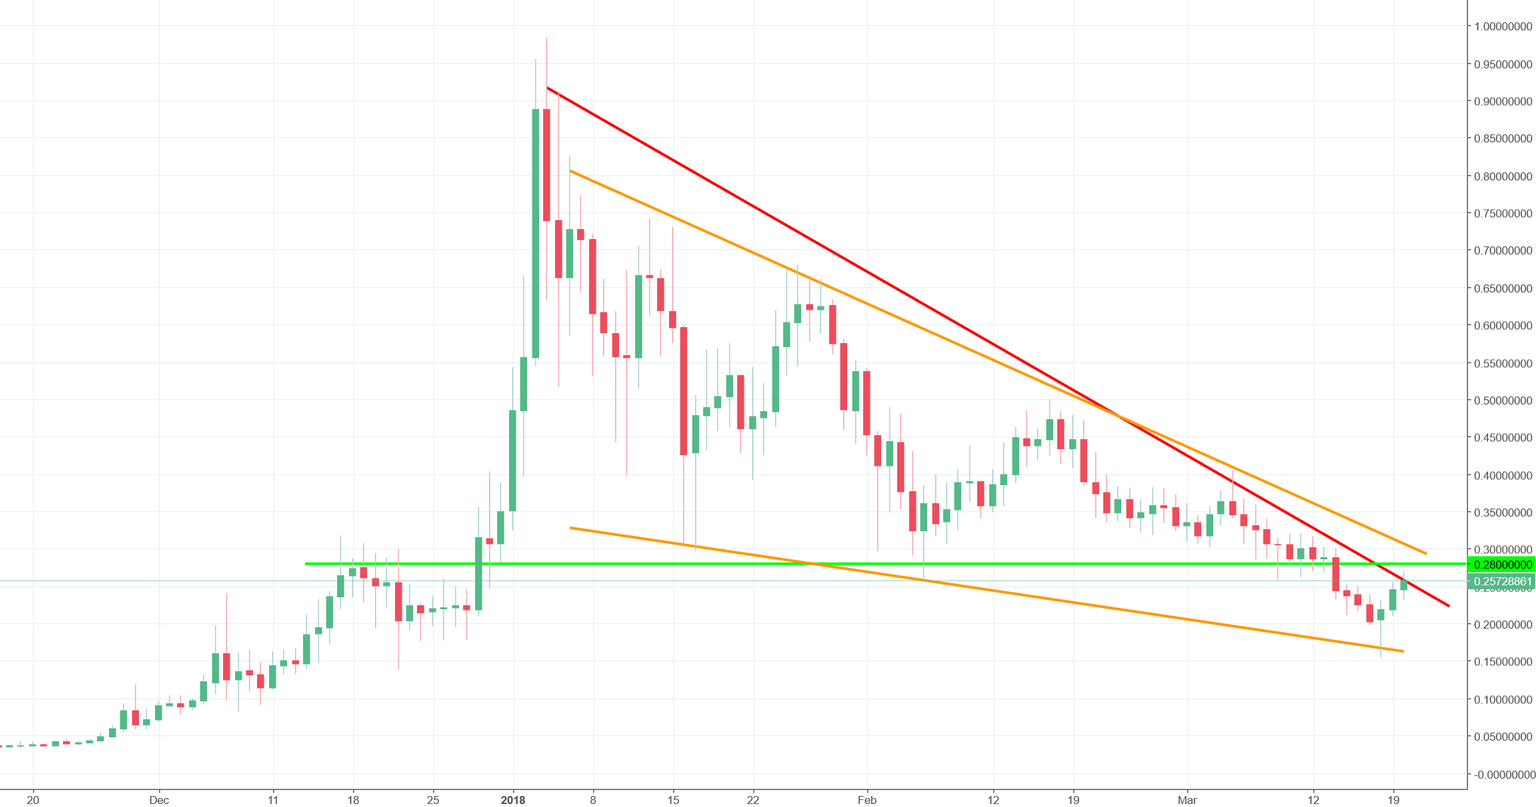
Quick look at the chart and we see that it is exactly what happened. The price broke the horizontal support and aimed for the lower line of the wedge. That was confirmed as an ultra strong support as shortly after the test, the price surged higher. Currently we are having a third bullish day in a row and we are quite close to a major buy signal. For that, we need to see the breakout of the red and orange down trend lines along with the green horizontal support. Price closing for a day above them, will be a strong signal to go long.


Comments (0 comment(s))