Crypto Report – Nice reversals! Dash, Bitcoin Cash and Litecoin
Another crypto report and another occasion to check our previous forecasts. If you follow us for some time, probably you should not be surprised that our analysis, in most of the cases, are spot on and calling them ‘reliable’ would be actually very modest. Anyway, let’s check the situation on Dash, Bitcoin Cash and Litecoin.
Dash was analysed by us on the 15th of March. The sentiment towards cryptos at that time was really bad but we were able to spot an interesting buying opportunity on the chart. In that piece we wrote:
„Really, a buy signal on a crypto? OK, maybe it is a bit too early but the situation is promising. The bounce from the support is now shaped like a hammer. This kind of candle is a strong buy signal. On any market and any time frame. What is more, this kind of setup, has usually a very good risk to reward ratio, so low risk (stop loss below the tale and support) and potentially high profit.”
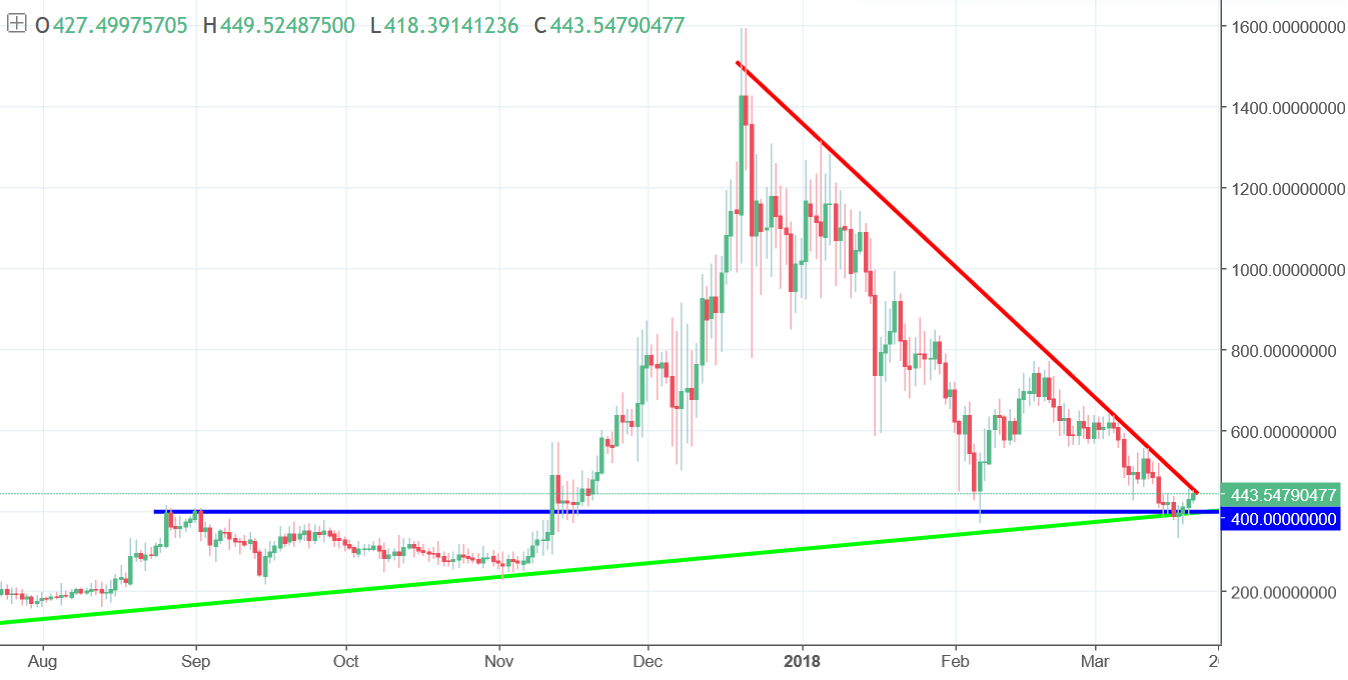
That was written, when the Dash costed 424 USD. The price indeed bounced from this support and the coin is now trading around the 445 USD. It did not happen straight away but yes, eventually the hammer candle on that support was created and the reversal did happen. Currently we stopped on the mid-term down trendline (red). Bullish breakout here will be a strong buy signal, which can bring us a further upswing in the next few days or even weeks!
The next instrument today is Bitcoin Cash. Piece about this crypto was also written on the 15th of March and surprisingly, we were also optimistic:
„Currently, buyers are doing everything to keep the bullish dream alive. The price is trying to create a hammer candlestick. This kind of a pattern on a major support like that would bring us a positive sentiment „
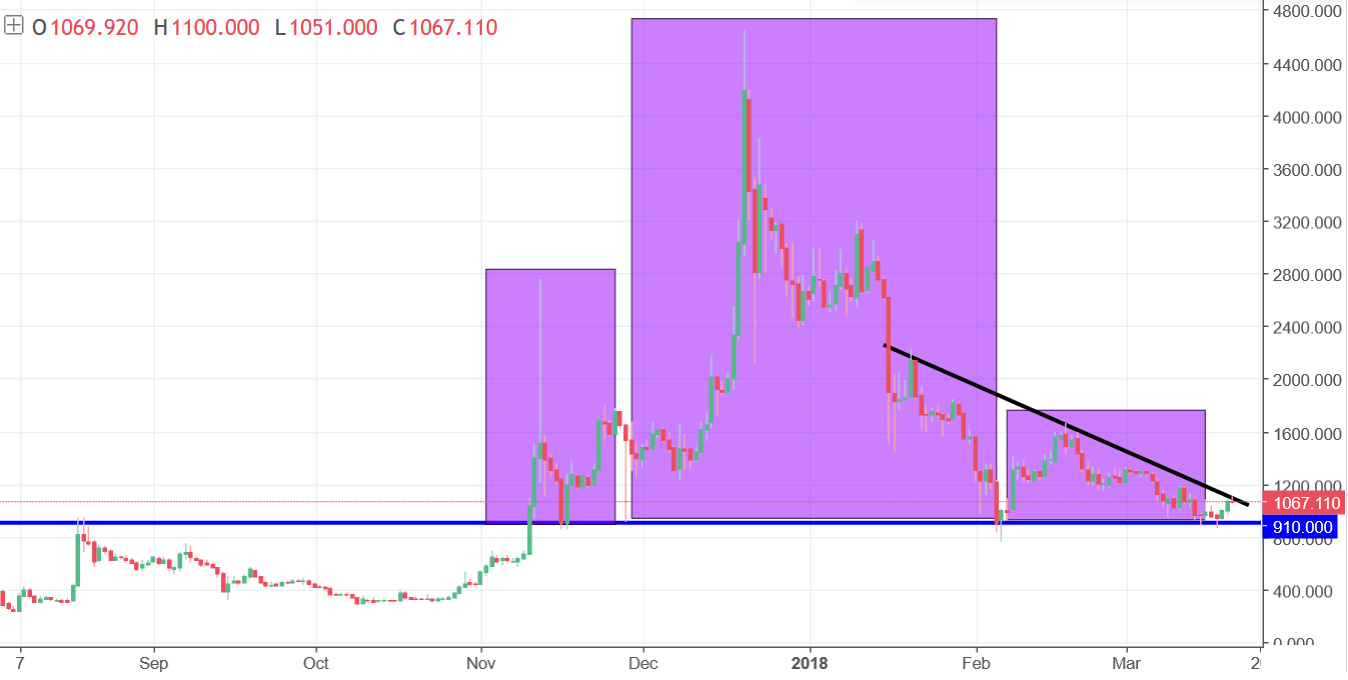
We were on a major support and you are right, it was eventually defended! The price did not manage to break the 910 USD and failed to cross the neckline. This is a positive sign and no wonder that we are currently trading around the1066 USD. Situation is similar to this one on the Dash. The price is very close to breakout of the mid-term down trendline (black), which can be a super strong buy signal. Do not get too optimistic though. We still have to watch out for the neckline. We are not high enough to forget about this level.
Last but not least – Litecoin. We dealt with this altcoin on the 16th of March and wrote that:
„The hope mentioned in the first paragraph comes from the fact that yesterday, LTC bounced from the lower line of the triangle and created a hammer candle on the D1 chart. That should take us to the upper line of this formation, so around 200 USD. „
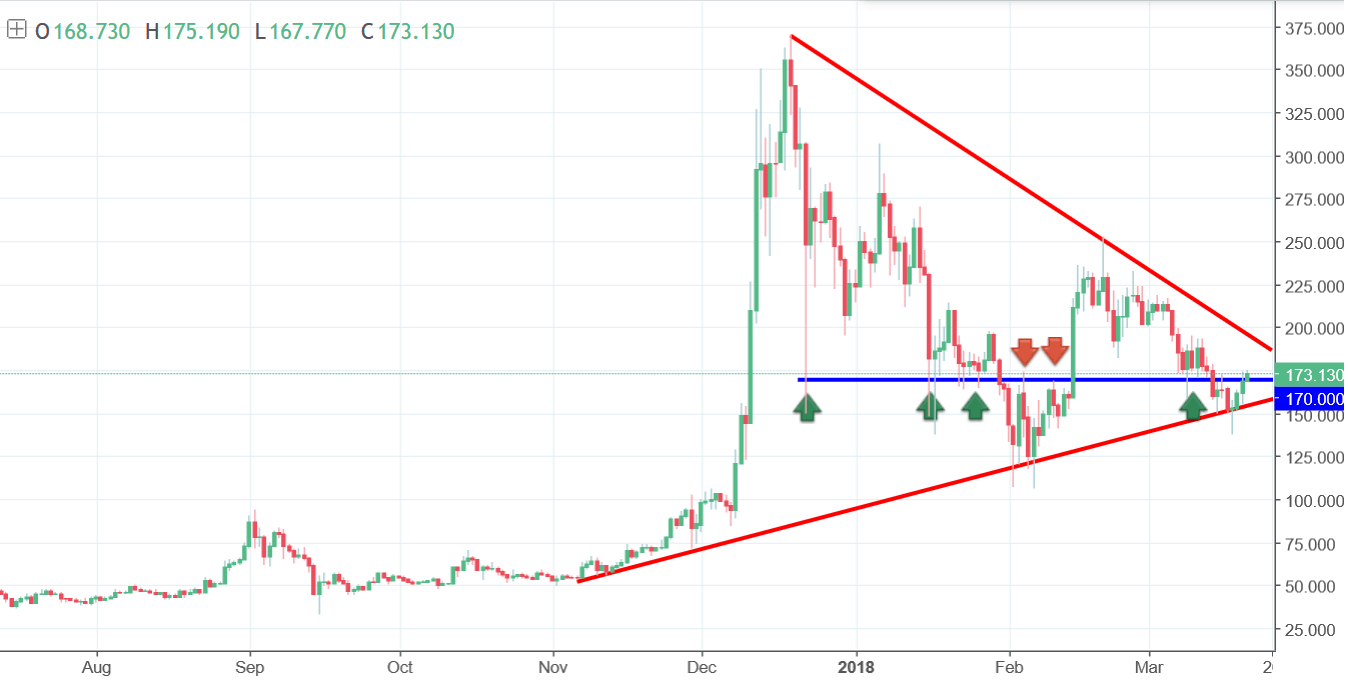
We bounced from that support then, we bounced again later and the final outcome is that we broke the 170 USD resistance and we are aiming higher. The first target here stays the same as previously – 200 USD. Litecoin is definitely an instrument which should stay on your radar. The price is slowly getting to the end of the symmetric triangle pattern and we are very close for a final decision – should we climb higher or fall lower. That signal should set the direction for the next few weeks, which potentially means huge profits…or losses.


Comments (0 comment(s))